How do exercise charts work?
Short answer
Every exercise in SmartWorkout has a chart of its whole history: estimated 1RM (e1RM), the weight and reps of the best set, and volume, or the longest time and distance for timed and distance exercises. Dragging scrolls the chart back in time, and pressing and holding shows one workout's results. Charts are free, with no limit on the period.
Where to open an exercise chart
You can open an exercise's chart from a workout, from your history and from the exercise details. Below the chart is a list of every workout with that exercise, with its sets and the e1RM and volume of each set, and tapping a workout's name opens that workout.
- During a workout: the chart icon next to the exercise name, or at the top of the screen in the "Simple" view.
- In your history: the chart icon next to the exercise in the workout details.
- In the exercise details: the chart icon at the top of the screen or the "Historical Data" row.
- The "Record" row in the exercise details opens the chart right at the workout with the record.
- If a coach in the app trains you, they see the same charts of your workouts.
What you see on the chart screen
From the top, the chart screen has these elements. The screenshot shows the Barbell Bench Press with the "3M" period and three lines turned on.
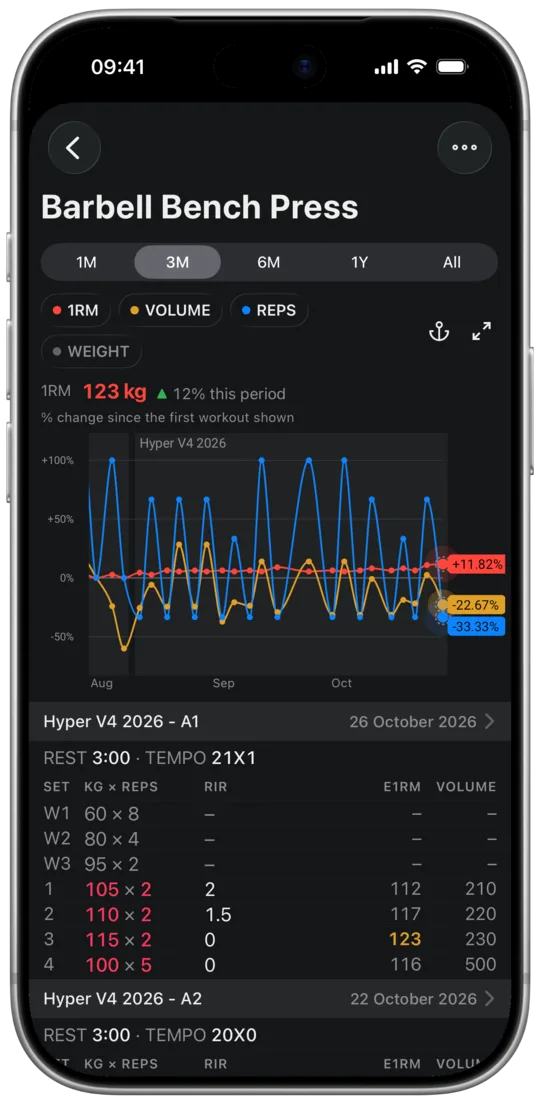
- The "1M", "3M", "6M", "1Y" and "All" buttons set how much time fits on the screen.
- The "1RM", "VOLUME", "REPS" and "WEIGHT" labels turn lines on and off. A colored dot means the line is on the chart, a gray one means it's off.
- The anchor pins the chart above the list of workouts, and the arrows next to it open it in full screen.
- The "1RM 123 kg ▲ 12% this period" row gives the value of the first line that is on in the last visible workout, and its change since the first visible one.
- The caption below it says how to read the chart: "% change since the first workout shown" when there are several lines, or "Line: average of 5 workouts · band: typical spread" when there is one.
- On the chart, each workout is one dot. A shaded stretch with a name at the top, here "Hyper V4 2026", is a period of workouts from one plan or template.
- Colored labels at the right edge give the last visible value of each line, and the dot they belong to has a dashed outline.
- Below the chart is the list of workouts with this exercise: name and date, rest and tempo, and the sets underneath. Warm-up sets are numbered W1, W2 and W3, working sets show RIR, e1RM and volume, and a record is highlighted in yellow.
What each line on the chart shows
Each line is one kind of result, with a point for every workout with that exercise. The labels above the chart turn lines on and off, and the last line that is on can't be turned off. Your choice applies to all exercises; at the start the first three labels are on.
- "1RM": the estimated 1RM (e1RM) of the workout's best working set, the one with the highest e1RM. Warm-up sets and drop sets don't count. With 1 rep the e1RM is the weight itself, with more reps it's the average of several common formulas.
- "WEIGHT" and "REPS": the weight and reps of that same best set. It's not always the heaviest set: with 100 kg × 1 and 95 kg × 8 the line shows 95 kg, because that set has the higher e1RM (119 kg).
- "VOLUME": weight times reps across all sets except warm-ups, drop sets included. For exercises with two dumbbells and for single-arm and single-leg exercises, volume is doubled.
- "TIME" and "DISTANCE": the longest set other than a warm-up, in timed or distance exercises.
- In bodyweight exercises, e1RM and volume are counted with the bodyweight saved with the set, or with the last saved one if the set has none.
Scrolling through your whole history
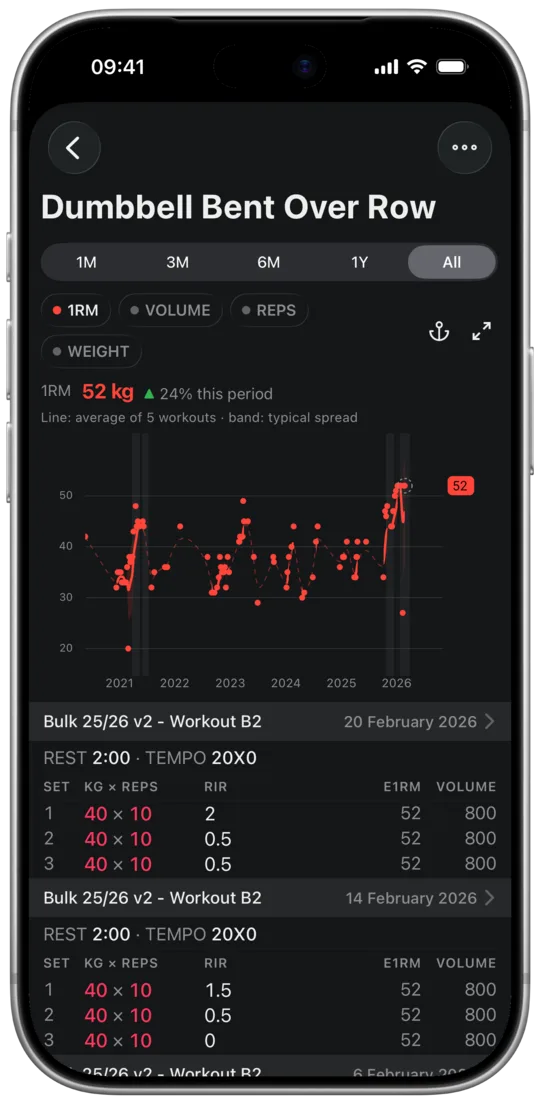
The "1M", "3M", "6M", "1Y" and "All" buttons set how much time fits on the screen. The rest of your history is right next to it: drag the chart to the right and you go back all the way to your first workout with that exercise. The vertical axis adjusts to the visible points as you scroll, so progress from a year ago doesn't get lost in the scale of your whole history.
With "All" you see the exercise's whole history at once, here the Dumbbell Bent Over Row since 2020.
- The app remembers the period separately for each exercise. At the start it's 3 months.
- When your whole history fits on the screen, for example with "All", dragging shows workout results right away, because there's nothing to scroll.
One workout's results
To see one workout's results, press and hold the chart for half a second. Keep moving your finger and the bubble shows the date, the name of that workout's plan or template, and the values of all lines that are on.
If one line covers the others, turn it off with its label above the chart. In the screenshot "REPS" is off, so the bubble shows only e1RM and volume.
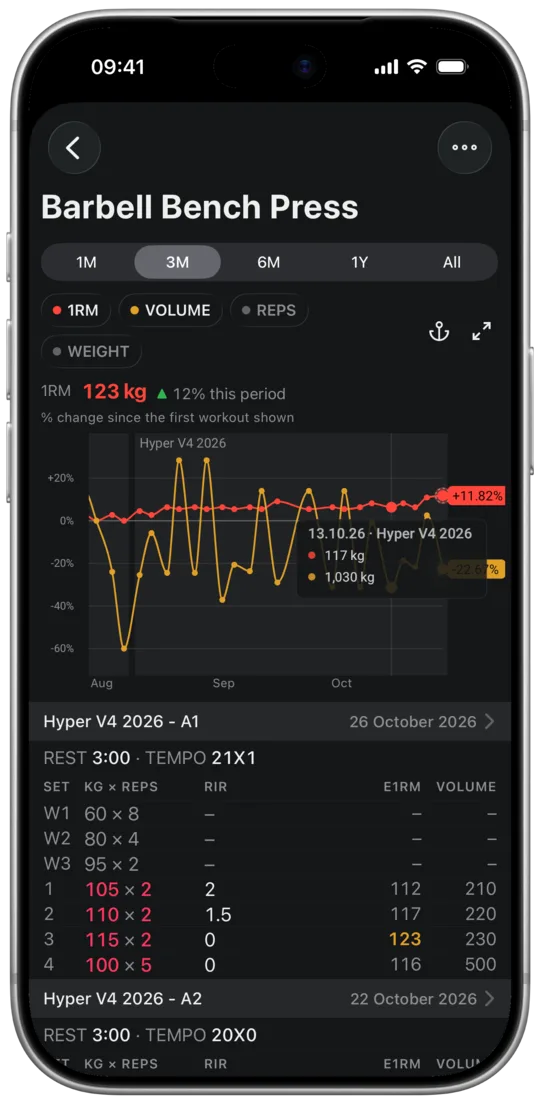
- At a record the bubble adds "PR": next to e1RM when it's an e1RM record, and next to the weight when it's a weight record.
- In bodyweight exercises the bubble also gives your bodyweight from that workout, e.g. "BW 82 kg".
Several lines on one axis: percent change
When you turn on lines with different units, for example 1RM, volume and reps, the chart puts them on one axis as the percent change since the first visible workout. The caption above the chart then says "% change since the first workout shown". When you scroll, 0% moves to the new first visible workout, just like on stock price charts.
- The labels on the right then give the percent change, while the bubble still shows kilograms and reps.
- "1RM" and "WEIGHT" on their own stay on a shared axis in kilograms, because they have the same unit.
- Percentages show what grows faster. When volume rises and e1RM stays flat, you're adding sets or reps, but not estimated strength.
One line: 5-workout average and typical spread
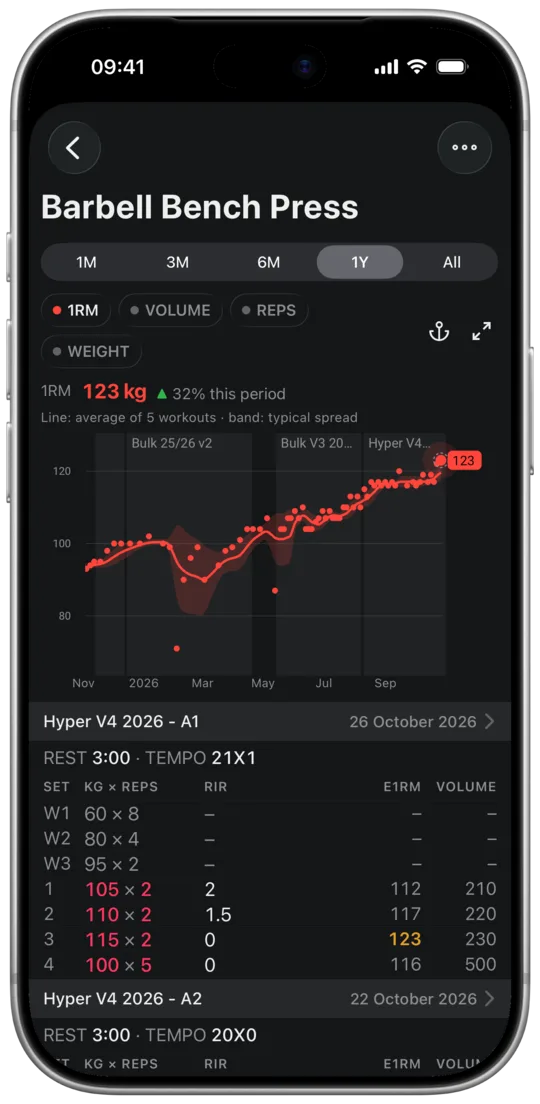
When you leave one line on and the exercise has at least 5 workouts, the chart shows your results as dots and a line with the average of your last 5 workouts. The band around it shows the range your results usually fall in, and the caption above the chart then says "Line: average of 5 workouts · band: typical spread".
Judge progress by the average line, not by a single dot. One workout 10 kg weaker lowers the average by only about 2 kg, and an average that stays flat for several weeks is a sign of a plateau.
Training breaks and plan and template periods
A break of more than 14 days between workouts is marked on the chart, so the line doesn't show a trend that wasn't there.
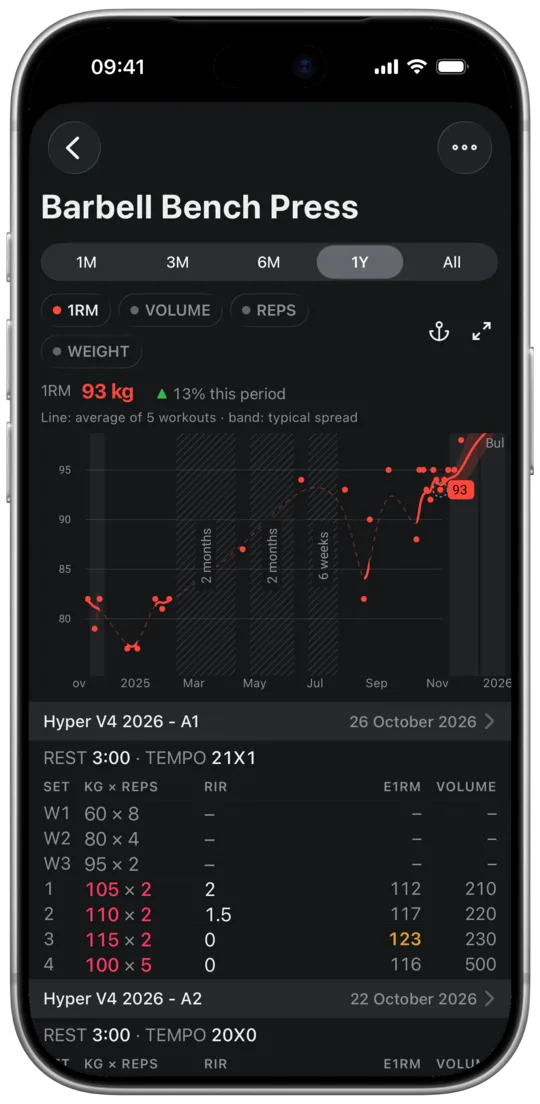
- During a break the line is thin and dashed, and a wider break gets a hatched area with its length, e.g. "6 weeks" or "2 months".
- The break from your last workout until today has a caption, e.g. "No data for 7 months".
- Workouts started from one plan or template form a shaded stretch with its name at the top. The stretch ends with another plan, another template or a break of more than 14 days, and a workout outside the plan doesn't interrupt it. That way you can compare the end of one plan with the start of the next.
- To turn the shading off, open the ⋯ menu at the top of the screen and, under "Highlight on the chart", tap "Workout Plans" or "Templates".
Full-screen chart
The arrows icon to the right of the labels opens the chart in landscape full screen, so turn your phone sideways. In full screen you have the exercise name, the result with its change over the period, the line labels and the period buttons, and the arrows icon in the top right corner takes you back to the normal view.
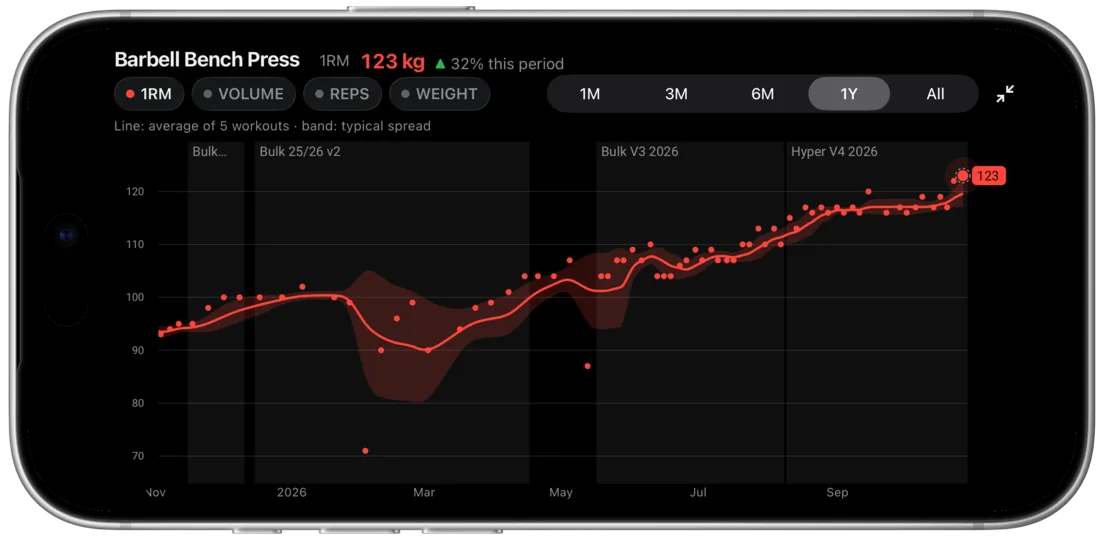
Chart pinned above the list
The anchor icon pins just the chart to the top of the screen, and the list of workouts scrolls underneath it. When the anchor is on, it's pink.
In the screenshot the chart is moved a few weeks back, so the list jumped to the October 5 workout, and its header sits right below the chart.
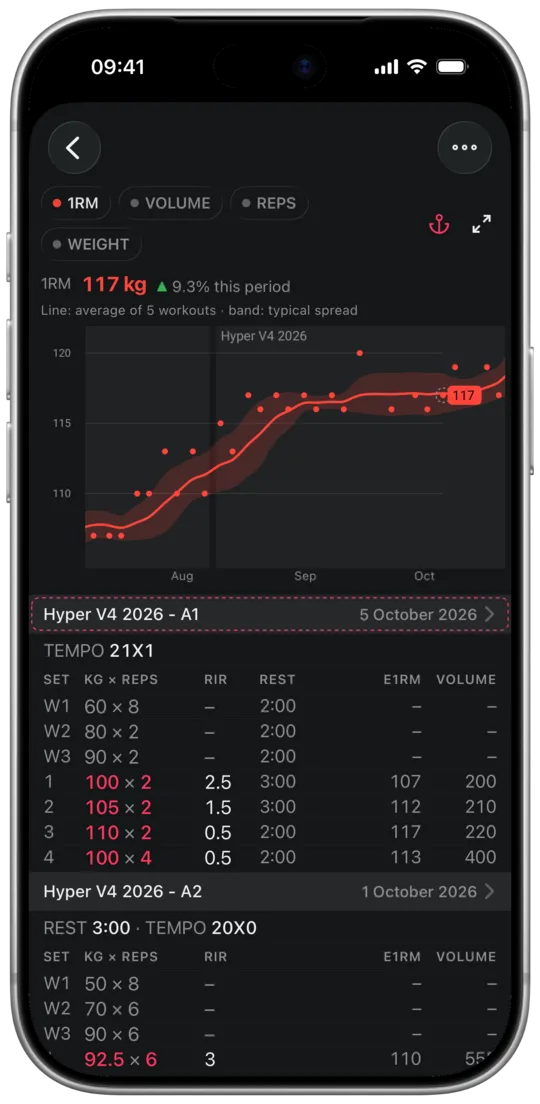
- The chart then shows the workout at the top of the list, and a dashed frame surrounds its dot and its row in the list.
- Pinning works both ways: when you scroll the chart, the list jumps to the workout at its right edge. That's how you find the sets from a workout where your e1RM dropped.
- The app remembers whether the chart is pinned.